How do you monitor LLM applications in production?
Monitor LLM applications in production by tracking latency, quality, cost, and safety metrics to keep models reliable and safe. This question focuses on practical observability patterns, alerting, and instrumentation you would implement for a live LLM system.
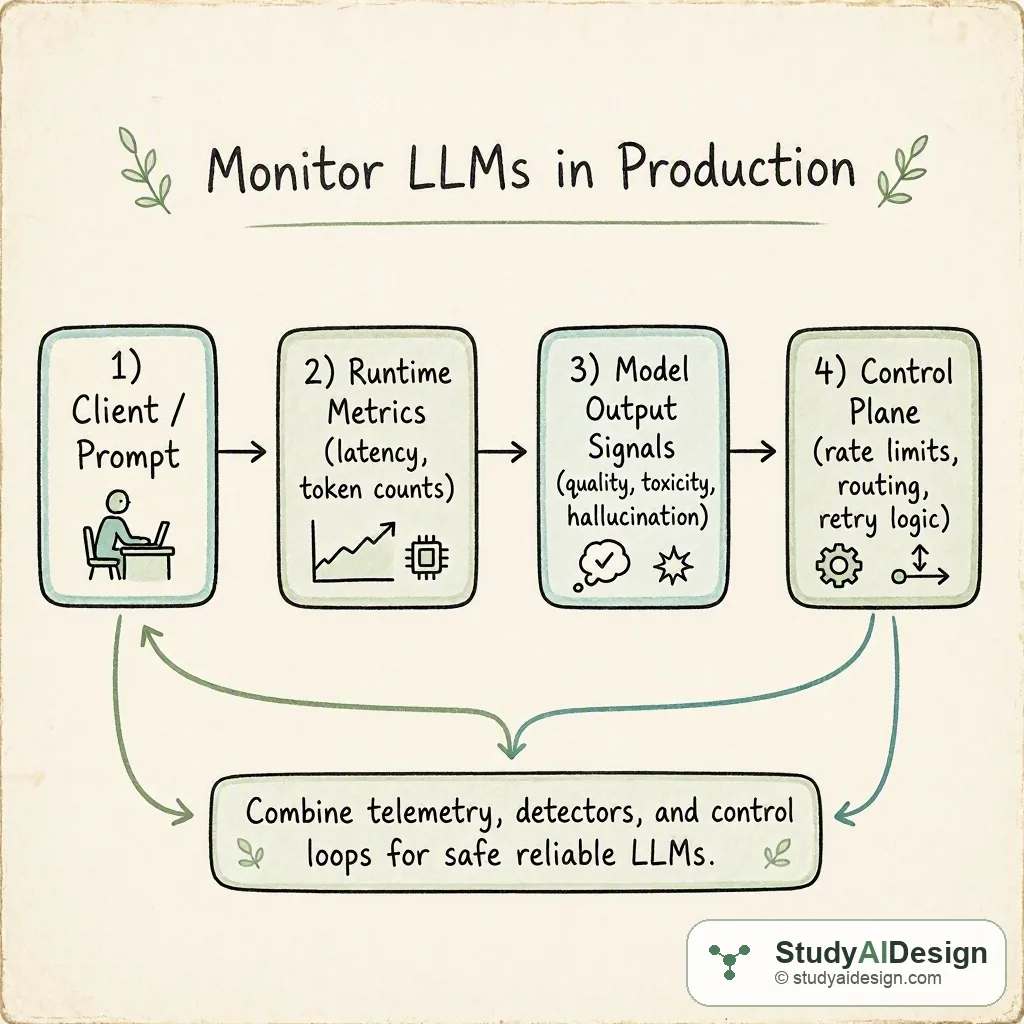
TL;DR
- Track runtime telemetry (latency percentiles, token counts, request volume) and model-output signals (hallucination rate, toxicity probability, calibration).
- Capture context: prompts, schema of responses, and feature flags so you can reproduce and triage issues.
- Implement automated detectors, SLOs, and control-plane actions like routing or throttling and surface human review paths. Key tradeoffs: response quality vs cost; detection precision vs false positive review load; telemetry granularity vs storage cost.
In this question, we will learn how to monitor LLM applications in production to keep latency, cost, and output quality under control. You will see which metrics to collect, how to detect bad model behavior, and practical control-plane actions to respond.
We will cover the following:
- What to measure
- How it actually works: a concrete example
- Instrumentation and storage choices
- Tradeoffs and failure modes
- Questions the interviewer might ask
Direct answer: instrument runtime telemetry and model-output signals, set SLOs and alerts, implement automated detectors and a control plane for mitigation, and keep prompt and context logging to enable fast triage. This balances proactive observability with automated corrective actions and human review.
The intuition (an analogy that makes it click)
Think of an LLM application as a delivery service. Runtime telemetry like latency and throughput are the vehicle speed and count. Model-output signals are package quality checks. If we only watch speed we miss broken items. If we only check packages without tracking routes we cannot find the cause. We need both continuous telemetry and specific quality checks, plus rules to reroute or pause deliveries when problems appear.
How it actually works (the real mechanics, with one concrete worked example)
We split what to detect into three groups: runtime, output quality, and business signals.
Runtime metrics
- Request rate (RPS)
- Latency percentiles, e.g., , ,
- Token counts per request
- Error rate and HTTP status codes
Model-output signals
- Hallucination detector score or downstream truth checks
- Toxicity probability
- Confidence or calibration measures for structured outputs
Business signals
- Cost per request
- Conversion or success events tied to responses
Concrete worked example
We operate a customer support chat using a 32k-token context model. We set SLOs: , hallucination rate , and average cost per request 0.15.
We collect telemetry and compute these rolling windows. Sample table for a 1 hour window:
| Metric | Observed | Threshold |
|---|---|---|
| latency | 1.35 s | 1.2 s |
| Hallucination rate | 1.8 % | 1 % |
| Avg tokens per request | 950 | 800 |
| Cost per request | $0.18 | $0.15 |
From the table we see both latency and hallucination are above thresholds. Root cause steps: inspect recent prompts, check model version routing, and examine token increase which explains cost and latency. A control-plane response might be immediate routing to a lighter model and enqueuing flagged conversations for human review.
Instrumentation and storage choices
Capture the minimum reproducibility surface for each request: request id, timestamp, prompt (or prompt hash and stored prompt blob), response, model id and version, tokens in/out, latency, and detector scores. We store summarized telemetry at high cardinality for 7 days and lower-resolution rollups for 90 days.
Practical tips
- Use request sampling for full-text storage to limit costs. Store 1% of requests fully and log hashes for the rest.
- Emit detector scores as numeric metrics not only as logs so you can alert on trends.
- Tag metrics with model version, deployment, and feature-flag to enable narrow rolls.
Automation and control plane
Monitoring alone is not enough. Build control actions mapped to alerts:
- Soft mitigation: switch to a cheaper or safer model variant, reduce context window, or truncate long system messages.
- Hard mitigation: reject requests that exceed safety thresholds and route to human review.
- Gradual rollouts: enable canarying where telemetry on new model versions runs in parallel before routing production traffic.
Comparison table for mitigation actions
| Action | Speed | Cost impact | Risk to UX |
|---|---|---|---|
| Route to smaller model | fast | lower | possible lower quality |
| Throttle requests | immediate | lowers cost | increases latency for queued users |
| Block and human review | slower | higher | anonymity for user, delay in response |
Tradeoffs and failure modes
Observability granularity increases storage and processing costs. Aggressive detectors reduce risk but create reviewer fatigue from false positives. Too little sampling makes triage hard. You must balance coverage with cost and human bandwidth.
Questions the interviewer might ask:
Some follow-up questions you might get:
How do you detect hallucinations in free text? Combine lightweight heuristics, retrieval-based grounding checks, and downstream verification where you ask the model to cite sources. Use a combination of automatic checks plus sampled human labeling to calibrate detectors.
What SLOs would you set for an assistant product? Pick latency percentiles like and , an error rate target, and a quality SLO such as hallucination rate under a threshold. Tie business metrics like conversion rate to model quality checks.
How do you handle PII or privacy when logging prompts? Mask or hash sensitive fields, use deterministic prompt hashing for reproducibility, and only persist full prompts under strict access controls and retention policies.
When do you route to a human versus automated mitigation? Route to human for high-severity safety flags or when automated fallback degrades critical functionality. Use automated mitigations for noncritical cost or latency pressure.
How do you monitor model drift after deployment? Track changes in detector scores, shifts in feature distributions like token counts or prompt lengths, and periodic re-evaluation on labeled holdout sets to detect performance degradation.
How would you instrument a canary rollout? Run the new model on a subset of traffic and compare telemetry side by side. Use shadow mode first, then small traffic percentages with monitored SLOs and automated rollback rules.
Some things to note:
- Balance sampling rate for logs versus storage cost.
- Keep detector metrics numeric and tag them by model version.
- Design alerting with playbooks that map to control-plane actions.
What the interviewer is really testing
They want to see you can translate model behaviour into measurable signals, design reproducible pipelines for triage, and implement automated control loops that avoid human overload. They also want to know you can balance technical constraints like cost and storage with safety and user experience requirements.
Further reading in the curriculum
Go deeper on the fundamentals behind this question.
- Evaluating AI Systems How to measure, monitor, and improve LLM system quality from offline eval sets through production observability.
Related questions
How would you rate the quality of this article?
Prepare for your AI engineering interview
This is one of many detailed questions and explainers on StudyAIDesign. Browse the full set, work through the curriculum, and walk into your interview ready.