What is LLM observability?
LLM observability explains how to instrument and monitor an LLM pipeline to detect drift, failures, and performance regressions. Learn core signals, a simple drift detector example, and practical tradeoffs for production monitoring.
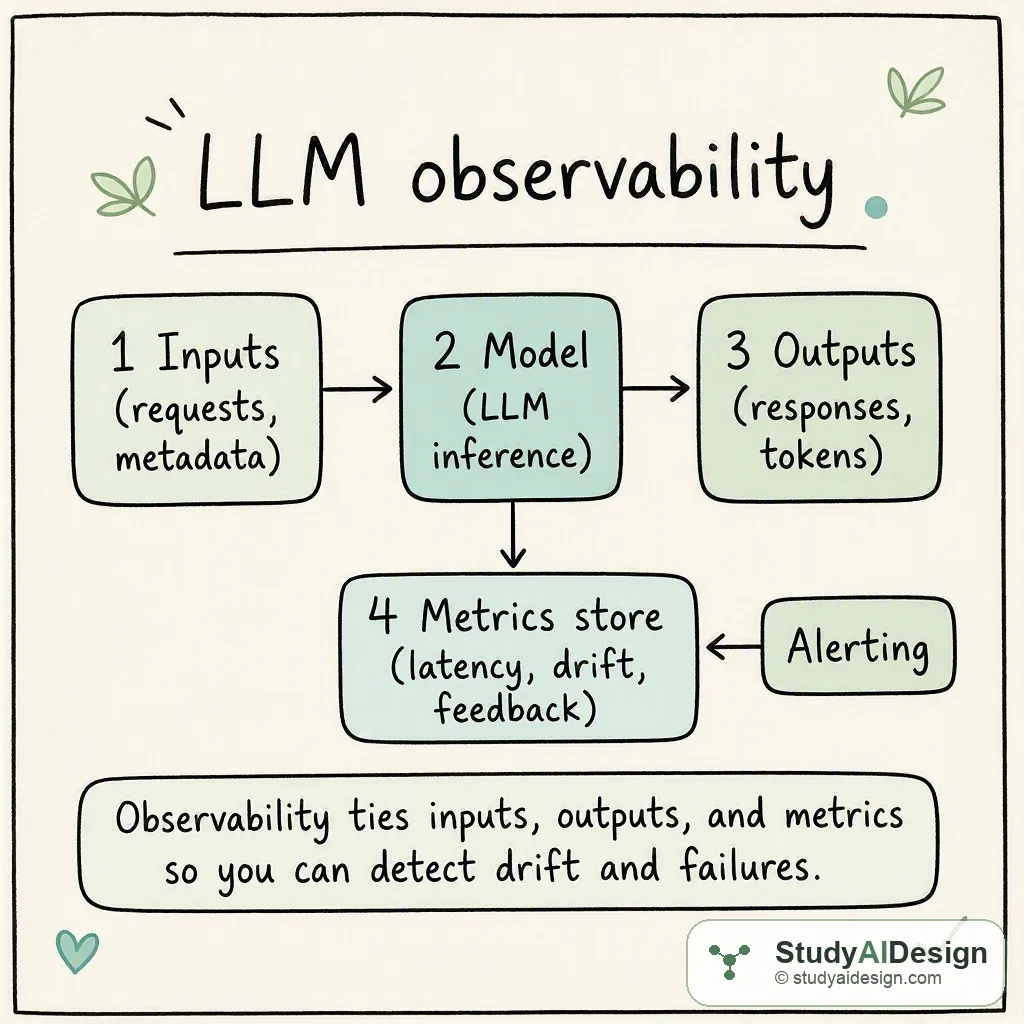
TL;DR
- LLM observability means instrumenting and measuring an LLM system's inputs, outputs, and internal signals to detect drift, failures, and performance regressions.
- Core signals include latency, error or hallucination rate, token or embedding distribution drift, and user feedback.
- A simple practical check is comparing current token distribution to a baseline with and alerting when it exceeds a threshold.
- Start with lightweight logs, a metrics store, and a human-review loop so you can iterate.
Key tradeoffs: sensitivity versus noise, privacy and cost of instrumentation.
In this question, we will learn what LLM observability is, why you would add it to an LLM pipeline, and a small worked example showing a drift detector you can implement quickly.
We will cover the following:
- The intuition
- How it actually works
- Signals and metrics
- Setting thresholds and alerts
- Tradeoffs and failure modes
- Questions the interviewer might ask
- What the interviewer is really testing
LLM observability is the practice of instrumenting an LLM pipeline to collect inputs, outputs, and derived signals so you can detect performance regressions, data drift, and safety failures. It combines automated metrics, statistical checks, and human review to give you a real time sense of model behavior and when to intervene.
The intuition (an analogy that makes it click)
Think of observability as the car dashboard for your LLM. We do not open the hood for every odd sound. We install gauges for speed, fuel, engine temperature, and a check engine light. For LLMs the gauges are latency, output quality, distribution changes, and human feedback. When a gauge moves out of its normal range we investigate the root cause rather than guessing.
How it actually works (the real mechanics, with one concrete worked example appropriate to the question; use a markdown table if you compare options or show numbers, and inline LaTeX for any math)
Observability has three practical layers we build.
- Instrumentation: log inputs, prompts, metadata, model outputs, and costs. Capture embeddings or token logs if privacy allows.
- Metrics and derived signals: compute latency, response length, token surprise, classification accuracy where you have labels, and distributional distances.
- Alerting and human workflow: thresholds, dashboards, and a ticketing path for human review.
A common, lightweight drift detector compares a baseline token distribution to the current period distribution using Kullback Leibler divergence. The formula is
Worked example. Suppose for a small vocabulary of two tokens we measured baseline and current . Compute .
| token | baseline | current |
|---|---|---|
| a | 0.6 | 0.4 |
| b | 0.4 | 0.6 |
Calculating gives . If our alert threshold is we would flag this window for investigation. The action might be sampling recent queries, checking prompt templates, or retraining on recent data.
Signals and metrics
We group observability signals by what they reveal.
| signal category | example metric | catches |
|---|---|---|
| latency and resource | median latency, p95 latency | infrastructure regressions |
| accuracy and quality | error rate, hallucination reports | model degradation on labels |
| distributional | token or embedding drift, KL or JS divergence | data shift and new intents |
| behavioral | perplexity, response length, repetition rate | prompt misinterpretation |
| human & business | user satisfaction, conversion | end to end impact |
Use computed metrics like token surprise or embedding distance. For embeddings you can compute average cosine distance between new inputs and the training centroid. Write that as inline math when needed, for example cosine similarity between vectors and is .
Setting thresholds and alerts
A pragmatic path is:
- Establish a baseline window of stable production, compute mean and standard deviation for each metric, and use control chart rules.
- For noisy signals use moving averages or an exponentially weighted moving average so short spikes do not alert you.
- Combine signals with simple rules. For example alert when latency increases by more than 2x and KL divergence exceeds threshold.
We prefer incremental automation. Start with informative dashboards and weekly checks, then raise to automated alerts when signal quality improves.
Tradeoffs and failure modes
Observability costs engineer time and storage and can create alert fatigue. You will also see false positives when user behavior legitimately changes.
Common failure modes:
- Missing instrumentation on rare but critical flows.
- Thresholds tuned on small or nonrepresentative baselines.
- Overfitting metrics for known failures while missing novel modes like social engineering prompts.
Questions the interviewer might ask
Some follow-up questions you might get: How do you detect hallucinations in a general LLM? We combine proxy signals like factuality checks against a knowledge base, answer overlap with trusted sources, and human spot checks. There is no perfect automated detector yet.
When would you prefer embedding drift over token distribution drift? Embedding drift catches semantic shifts even if token frequencies barely change. Use embeddings when you care about meaning and have vector infrastructure.
How would you handle privacy when logging prompts? Use hashing, token-level sampling, or only store derived features like embeddings or counts. Apply strict retention and access controls.
What statistical test would you use for distribution drift? Common choices are KL divergence, Jensen Shannon divergence, or two sample tests like Kolmogorov Smirnov for continuous features. Pick based on data type and sample size.
How do you choose alert thresholds? Start with baselines from stable windows, use percentile based thresholds, and tune with oncall feedback to balance precision and recall.
How can active learning fit into observability? Use high surprise or high uncertainty examples to surface candidates for labeling and retraining. That connects observability to model improvement pipelines.
Some things to note:
- Instrumentation quality beats fancy analytics. If you do not capture the right fields you cannot measure them.
- Alerts should include context: sample inputs, recent trends, and links to replay experiments.
- Human review loops are essential for reliability.
What the interviewer is really testing
They want to see that you can design practical, prioritized observability for LLMs. Show that you know which signals are cheap and high value, how to avoid alert fatigue, and how to convert observed issues into concrete actions like sampling, rolling back, or retraining. Concrete examples and simple math show you understand both the engineering and the statistics.
Further reading in the curriculum
Go deeper on the fundamentals behind this question.
- Evaluating AI Systems How to measure, monitor, and improve LLM system quality from offline eval sets through production observability.
Related questions
How would you rate the quality of this article?
Prepare for your AI engineering interview
This is one of many detailed questions and explainers on StudyAIDesign. Browse the full set, work through the curriculum, and walk into your interview ready.